Iran Conflict – Venture Market Impact, Sector Positioning and Capital Allocation
1. Introduction
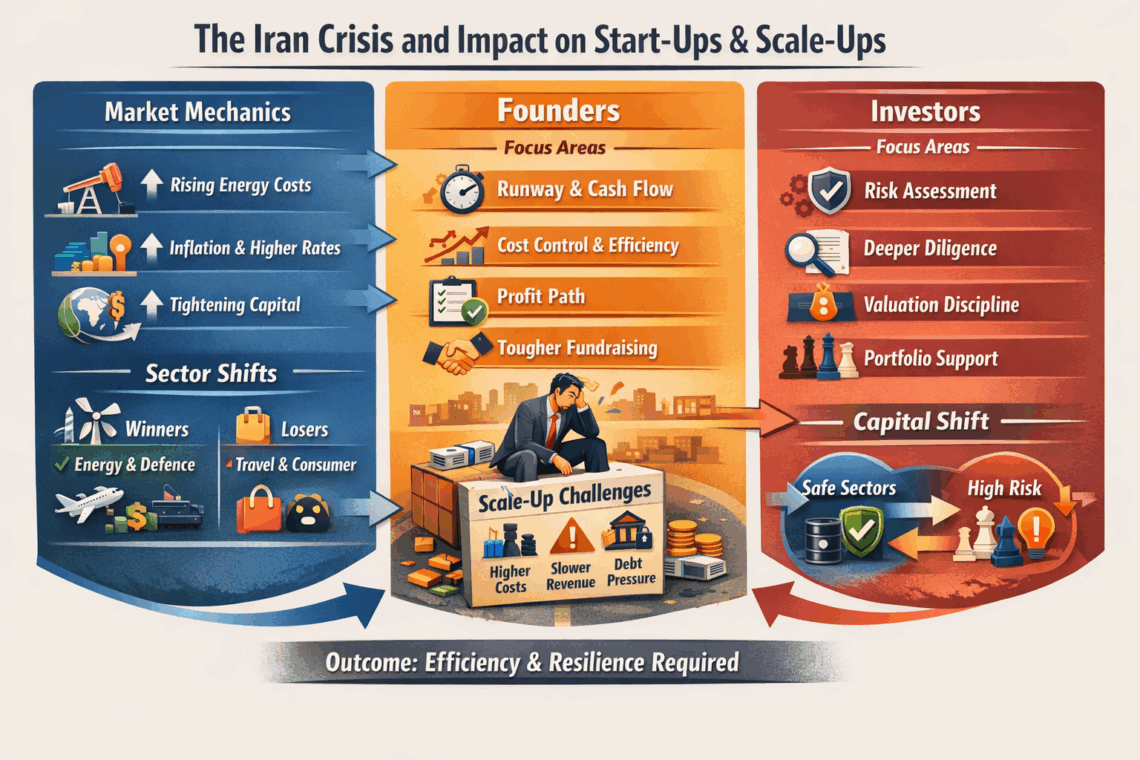
This article provides a board-level view of how the Iran conflict is impacting venture capital deployment, portfolio risk, and sector positioning, with clear guidance on capital allocation.
2. Key Takeaways
The current environment represents a repricing of risk rather than a withdrawal of capital. Liquidity remains in the system but is being deployed with significantly higher selectivity. Cost of capital is rising through energy-driven inflation. This is compressing valuations, extending deal timelines, and increasing the importance of cash flow visibility.
Sector divergence is accelerating. Capital is concentrating around resilience, security, and infrastructure while moving away from discretionary and capital-intensive growth models. Portfolio management behaviour has shifted toward capital preservation, with increased reserves and extended runway expectations.
3. Macro Impact on Venture Markets
| Driver | Current Movement | Venture Impact | Implication |
|---|---|---|---|
| Oil prices | +30 to 35 percent | Inflation pressure | Higher discount rates, lower valuations |
| Interest rates | Elevated / sticky | Cost of capital increases | Reduced deal velocity |
| Shipping insurance | +80 to 300 percent | Supply chain disruption | Margin compression in physical businesses |
| Investor sentiment | Deteriorating (Europe most impacted) | Slower LP deployment | Harder fundraising environment |
| Private credit exposure | >$500bn globally | Increased systemic sensitivity | Higher default and refinancing risk |
4. Venture Market Behaviour
| Area | Pre-conflict | Current Behaviour | Direction of Travel |
|---|---|---|---|
| Deal speed | Fast | Slower, extended diligence | Continued slowdown |
| Valuations | Growth-led | Fundamentals-led | Further compression likely |
| Capital allocation | New deals prioritised | Portfolio support prioritised | Defensive posture maintained |
| Runway expectations | 12 to 18 months | 24 to 30 months | Structural shift |
| Investment criteria | Growth and TAM | Profitability and resilience | Permanent change |
5. Sector Impact and Scoring
Scoring based on three dimensions
Demand tailwind
Capital inflow likelihood
Operational resilience
Scale 1 to 5 where 5 is strongest
Sector Positioning Table
| Sector | Demand Tailwind | Capital Inflow | Resilience | Composite Score | Position |
|---|---|---|---|---|---|
| Defence tech | 5 | 5 | 5 | 5.0 | Strong positive |
| Cybersecurity | 5 | 5 | 5 | 5.0 | Strong positive |
| Energy and climate (security-led) | 5 | 4 | 5 | 4.7 | Positive |
| AI (commercial applications) | 4 | 4 | 4 | 4.0 | Selective positive |
| Domestic manufacturing / reshoring | 4 | 4 | 4 | 4.0 | Positive |
| Logistics and supply chain | 3 | 2 | 2 | 2.3 | Negative pressure |
| Hardware / manufacturing (global) | 2 | 2 | 2 | 2.0 | Negative |
| E-commerce (global fulfilment) | 2 | 2 | 2 | 2.0 | Negative |
| Travel and mobility | 2 | 1 | 2 | 1.7 | Highly exposed |
| Growth SaaS (capital intensive) | 3 | 2 | 3 | 2.7 | Valuation pressure |
6. Sector Commentary
Defence and cybersecurity are now core venture categories rather than edge cases. Demand is being driven by government spend, sovereign priorities, and real-time threat environments. European players such as Helsing are already seeing significant capital inflows, with Gulf sovereign wealth expected to deploy at scale.
Energy investment is shifting from sustainability-led to security-led. This benefits storage, grid resilience, and domestic energy infrastructure rather than purely carbon reduction narratives. AI remains investable but is no longer insulated. Capital is concentrating around applications with clear commercial traction and defensible data advantages.
Logistics, hardware, and global e-commerce models are under pressure due to cost volatility and supply chain disruption. These sectors are not uninvestable, but require stronger margins and operational control.
7. Portfolio Risk Management
Current Fund Behaviour
| Strategy | Action | Rationale | Outcome |
|---|---|---|---|
| Runway extension | Reduce burn, extend to 24 to 30 months | Reduced reliance on external funding | Increased survivability |
| Reserve allocation | Higher follow-on capital held back | Protect core portfolio | Reduced new deal activity |
| Valuation reset | Repricing based on higher rates | Reflect macro reality | More realistic entry points |
| Scenario modelling | Oil, rates, supply chain stress tested | Anticipate downside | Better risk visibility |
| Exposure reduction | Limit conflict-adjacent geographies | Reduce volatility | Improved portfolio stability |
8. Capital Allocation View
Recommended Allocation Shift
| Category | Pre-conflict Allocation | Current Allocation | Direction |
|---|---|---|---|
| Defence and security | Low | High | Increase materially |
| Cybersecurity | Medium | High | Increase |
| Energy and climate | Medium | High | Increase |
| AI | High | Medium to high | Concentrate selectively |
| Consumer / discretionary | Medium | Low | Reduce |
| Logistics / global supply chain | Medium | Low | Reduce |
| Growth SaaS | High | Medium | Rebalance toward profitability |
| Emerging markets | Medium | Selective | Focus on stability |
Capital Deployment Strategy
| Priority | Focus Area | Investment Criteria |
|---|---|---|
| Tier 1 | Security and resilience sectors | Immediate demand, government backing, strong margins |
| Tier 2 | Infrastructure and energy | Long-term structural demand, regulatory support |
| Tier 3 | AI and software | Proven revenue, defensible positioning |
| Tier 4 | Select opportunistic distressed | Discounted entry, strong fundamentals |
9. Geographic Positioning
| Region | Impact Level | Capital Flow Direction | Commentary |
|---|---|---|---|
| United States | Moderate | Stable | Less direct exposure, rate-driven impact |
| Europe | High | Selective | Weak sentiment, strong defence upside |
| Middle East | High | Mixed | Uncertainty offset by sovereign capital |
| Israel (benchmark) | High but resilient | Active | Demonstrates ecosystem strength under conflict |
| Asia (India, SEA) | Low to moderate | Increasing | Benefiting from reallocation |
| Emerging markets | High | Reducing | Exposure to capital flight and debt costs |
10. Forward Outlook
0 to 12 months
Expect continued volatility in deal flow and valuation. Investment activity will remain active but concentrated in fewer sectors. Portfolio support will take precedence over new deployment.
1 to 3 years
If the conflict stabilises, venture markets will recover but with a different sector weighting. If prolonged, higher interest rates and inflation will become embedded, reinforcing a shift toward profitability and capital efficiency.
Structural shift
The venture model is transitioning. Growth without discipline is no longer being funded at scale. Capital is aligning with resilience, infrastructure, and strategic importance.
11. Bottom Line for Investors
Capital remains available but is being deployed with discipline and purpose. The opportunity set is strongest in sectors aligned with geopolitical priorities, energy security, and digital resilience. Portfolio strategy should prioritise survivability, capital efficiency, and exposure to sectors with structural demand tailwinds. The current environment favours investors who can combine macro awareness with selective conviction.